
-
Faulkes Telescope Project Privacy Policy
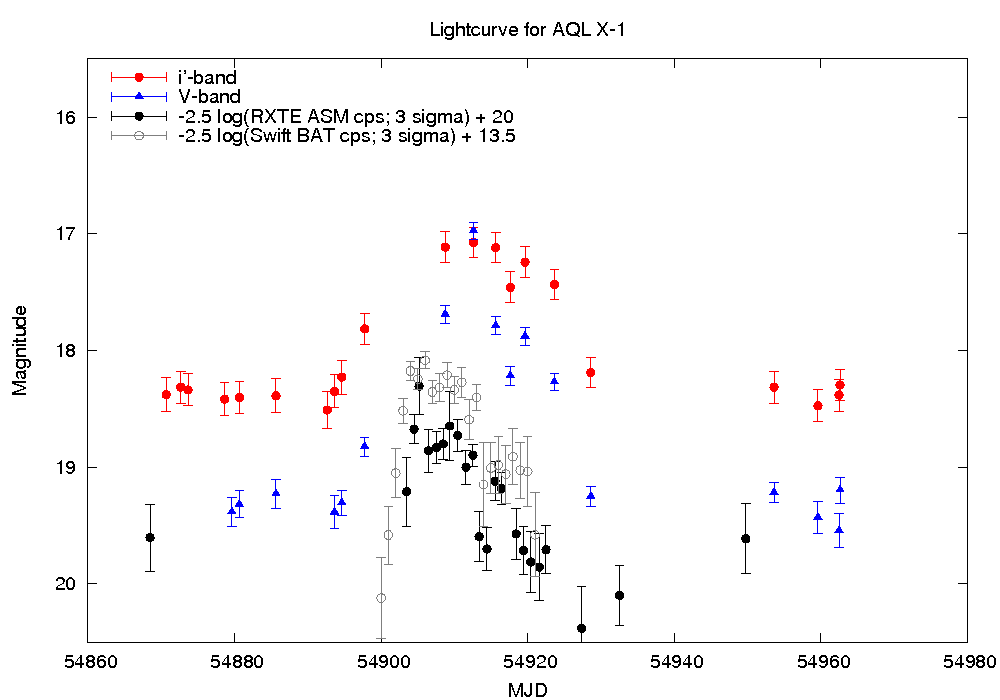
Faulkes Telescope light curves of Aquila X-1
Faulkes Telescope North and South contributed data to the Astronomy and Astrophysics paper, “The evolving jet spectrum of the neutron star X-ray binary Aql X-1 in transitional states during its 2016 outburst”
See also long-term lightcurves at Dipankar Maitra and Charles Bailyn’s page and their resulting ApJ paper.
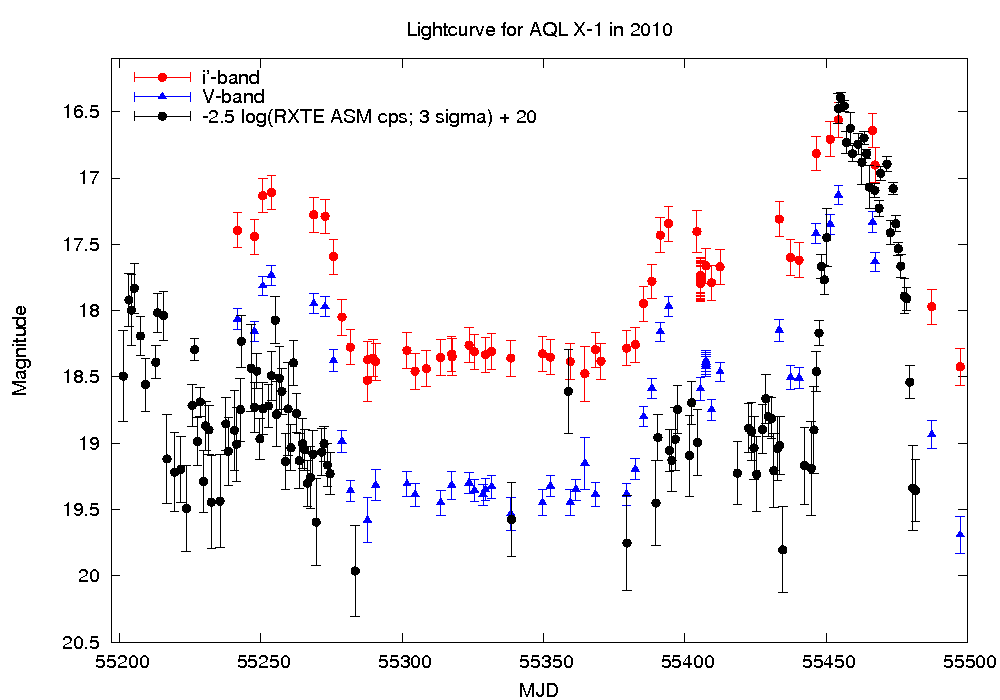
The 2010 Faulkes Telescopes light curve (including data from the RXTE ASM)
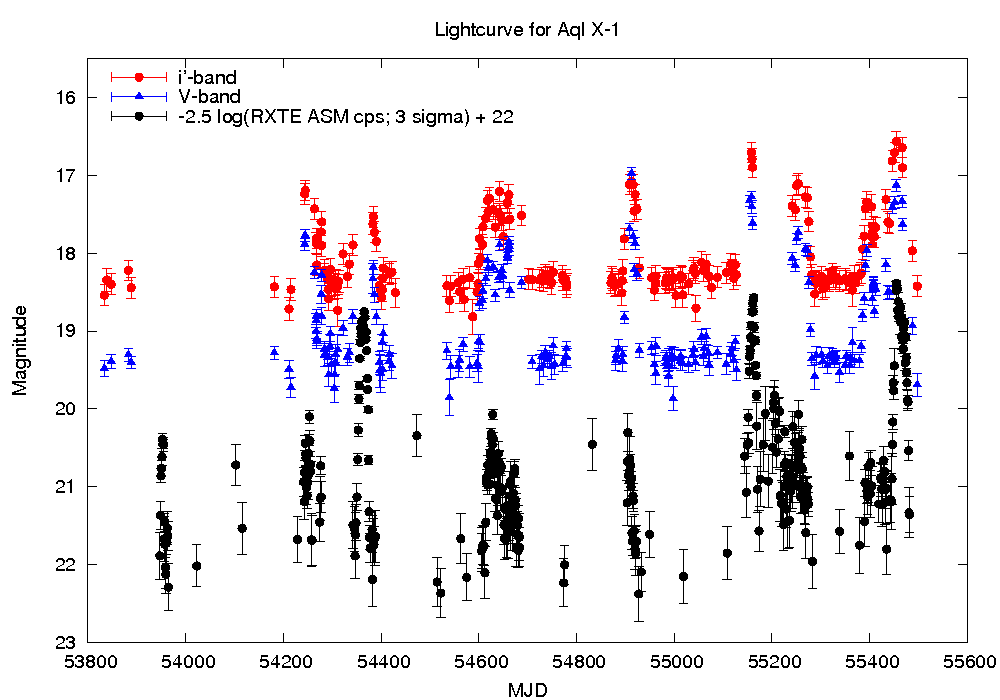
The Faulkes long term light curve (outbursts in May 2007, Sep 2007, Jun 2008, Mar 2009, Nov 2009, Jul-Sep 2010):
The JACPOT XRB team monitored the Nov 2009 outburst at radio, infrared, optical, UV and X-ray frequencies.
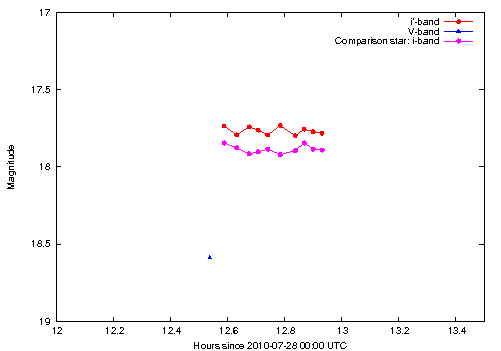
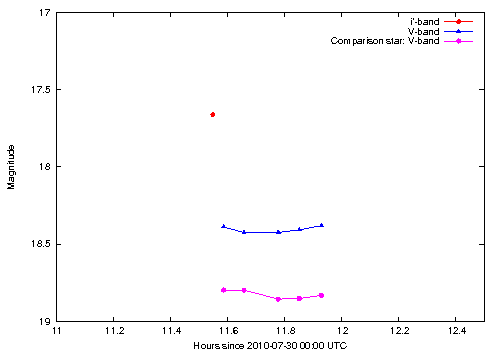
Variability study of Aql X-1 on 2010-07-28 (top; i’-band) and 2010-07-30 (bottom; V-band):
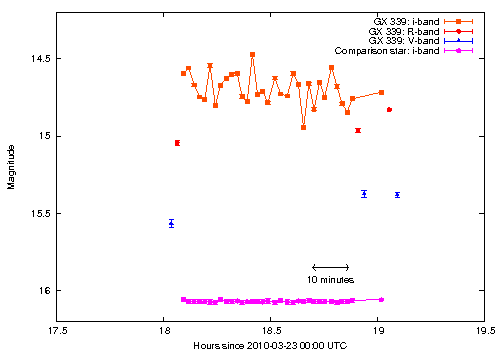
Comparison: GX 339-4 on 2010-03-22 (i’-band; in the hard state):
The March 2009 outburst light curve (including Swift/BAT data provided by the Swift/BAT team):
Click here to return to the main XRB page
Posted in Uncategorized
© Faulkes Telescope Project